Visar inlägg med etikett CO2. Visa alla inlägg

måndag 15 augusti 2022

Logarithmic Effect of More CO2 without Theoretical Basis

To serve as a basis for CO2 alarmism (together with back radiation), IPCC put together the following formula with inspiration from the Beer-Lambert law (exponential transport decrease in an absorbing medium):

  • $\Delta RF = 5.35\ln (C/C_0)$ 
where $RF$ is Radiative Forcing from CO2 as a greenhouse gas, $\Delta RF$ is additional forcing caused by a change of concentration of atmospheric CO2 from $C_0$ (preindustrial) to a present $C$. Doubled concentration from preindustrial level would then cause an additional (warming) forcing of about $4$ Watts/m2, which is translated to 1C warming by Stefan-Boltzmann, which by feed back can become anything you like 1-5C with 5C utterly alarming! Note that without the 1C from the formula, feedback has nothing start from and so it is an absolutely crucial element of CO2 alarmism!

  • Even though there is no theoretical basis for the Beer-Lambert formula, ∆RF = αln(C/Co), it has been accepted by the scientific community as a reasonable approximation.
but somewhat disappointingly ending up with:
  • In this paper we propose an improved mathematical approximation that, like the Beer-Lambert law, has no theoretical basis.
Does a formula with no theoretical basis have a serious defect? Not always, since a formula may capture observations as some form of condensed experience. The validity of the formula can then be checked against observation/experience, and so be falsified. 

However, if there is no way to check the validity of the formula by observation, and this is the case with the above formula, then lack of theoretical basis is a serious defect because theory is what remains if you take away observation. 

So IPCC relies in its prediction of the warming effect of doubled CO2 on a formula which has neither theoretical basis nor observational support. You can say that this is shaky. How can you proclaim Net Zero with all its devastating consequences from nothing? It seems you must have some hidden agenda. You can learn about the agenda in new best seller The Truth about Energy, Global Warming, and Climate Change: Exposing Climate Lies in an Age of Disinformation by Jerome R. Corsi.

lördag 30 juli 2022

The Catch of CO2 Alarmism vs Homeopathy

The catch of CO2 alarmism is that CO2 as an atmospheric trace gas is claimed to have considerable impact on global temperature as a "greenhouse gas", by IPCC estimated to 3-5 C warming upon doubling of the concentration from 0.03% in preindustrial time, with today 0.04%. It is also claimed that this reflects a near saturation (logarithmic) effect of CO2 with additional warming from another doubling being very small. The catch is then that CO2 as a greenhouse gas of very small concentration is claimed to have a big effect up to 0.03% as a very substantial part of an estimated total atmospheric effect of +33 C, but much smaller effect above 0.03% by saturation. 

Now, a physical system for which a small cause can have a big effect is an unstable system and as such cannot persist over time. This is like steering your car with a very small joystick sensible to every little shake of your hand. You do not get far with such a control mechanism. 

So, if global temperature is largely controlled by CO2 as a trace gas as a very small cause, the Earth faces the possibility of a "runaway greenhouse effect" with huge warming upon doubled CO2. But this is not what we see when observing less than 1 C warming with CO2 raising 0.01% from preindustrial level. The proposed explanation is saturation of the warming effect of CO2 as a greenhouse gas, which then must have been reached already today. 

But there is another more natural explanation of the little observed warming from increased CO2, namely that CO2 as trace gas has no (observable) influence on global temperature at all. This is like removing the control function of steering your car from the sensitive joystick to a conventional steering wheel. You can then let your kids play with the joystick as much as they want under an illusion that they steer the car. 

This connects to a principle of homeopathy of dilution where the concentration of a substance supposed to be beneficial can be reduced to only a trace while keeping/improving the effect. You can then be a believer, or you can as a non-believer say that the substance has no beneficial effect whatsoever independent of dose. 

The catch of CO2 alarmism is thus to claim a big effect from a small cause without runaway effect and then eliminate the possibility that the small cause de facto has only a small effect. This dilemma has not been resolved. 

The big effect of CO2 as trace gas is claimed to be demonstrated by its blocking effect (causing warming) on Outgoing Longwave Radiation OLR as the big ditch in the radiation intensity spectrum around frequency 600 as reported by AIRS spectrometers in satellites with the green curve representing OLR from an atmosphere without CO2 as presented by William Happer (time 25.00) (see also article):

The effect of doubling CO2 is represented by a slight broadening of the ditch in red upon doubling as a small effect by saturation. The ditch in OLR causing global warming is thus presented as a big effect up to 0.03% and a small effect upon doubling, as discussed above with connection to homeopathy.

But there is a catch in the above spectrum, since what AIRS de facto measures is the temperature of atmospheric CO2 at the highest level where it can be detected (220 K at the tropopause), which is possible even at trace concentrations, but what is reported is radiation intensity from Planck's Law as if CO2 as a trace gas is blocking considerable amount of radiation. The above diagram is presented as the main evidence that CO2 as trace gas causes considerable global warming, but then without runaway effect. But the diagram can be questioned since it reports something which is not directly measured. Maybe a true OLR has no ditch and so no (observable) warming from CO2. Maybe the spectrometer acts as a ghost detector like that detecting Downwelling Long Wave Radiation DLWR discussed in this post. What do you think? 

Happer is a skeptic claiming little warming from doubled CO2 as the slight broadening of the ditch. But Happer seems to believe in its present big effect represented by the green curve without ditch. It would be interesting to hear what Happer says about the possibility that the diagram is the result of ghost detection, and so I have asked him and am waiting for response.

PS1 The fact that an AIRS spectrometer directly measures temperatures and not radiation intensity (like a pyrgeometer) is supported by the fact that it contains both coolers and radiators at 150 K and 190 K. Also recall this post.

PS2 Communication with Will Happer: (see invitation to TNT Radio)

Claes: 

Does a pyrgeometer directly record temperature or radiation intensity? 

Will: 

RADIATION INTENSITY AND TEMPERATURE ARE TWO DIFFERENT THINGS. PYROMETERS MEASURE RADIATION INTENSITY (OR FLUX), NOT TEMPERATURE. IN EARTH'S ATMOSPHERF RADIATION IS SELDOM EVEN CLOSE TO A THERMAL EQUILIBIUM STATE (THE PLANCK STATE) WHICH CAN BE DESCRIBED BY A TEMPERATURE. THE CLOSEST THING TO THIS SITUATION IS THE INTERIOR OF OPTICALLY THICK CLOUDS AT NIGHT, WHEN SHORT MEAN FREE PATHS FOR THERMAL RADIATION AND THE ABSENCE OF SUNLIGHT PRODUCE NEAR EQUILIBRIUM THERMAL RADIATION AT THE TEMPERATURE OF THE LOCAL CLOUD PARTICULATES.

Claes: 

Thanks for response, which I much appreciate. We are both (CO2 alarmism) skeptics and so a main question can be what arguments are best to debunk CO2  alarmism. You seem to say that a pyrgeometer directly measures radiation flux and not temperature, whereas I have the opposite impression. 

Let us seek an answer by looking into the design of a pyrgeometer, which consists of (1) a thermopile reading/measuring voltage U scaling with end temperature difference dT, (2) a silicon dome/window and (3) temperature sensor measuring the temperature T_dome of the dome. The source temperature T_source can then (after calibration) be determined as T_source = T_dome + dT. Again, what is de facto measured is (1) voltage U scaling with dT and (3) thermopile temperature

There is, as far as I understand, no sensor measuring incoming radiation flux into the dome. Incoming radiation is calculated by postulating outgoing radiation according to Planck-Stefan-Boltzmann of magnitude sigma T_dome^4, but this is a fictional quantity as if the dome is in radiative contact with outer space at 0 K but in fact is in radiative contact with a source of higher temperature.

A. Can we agree that what de facto is measured is (1) thermopile voltage scaling with end temperature difference and (3) dome temperature?

B. Can we agree that there is no sensor directly measuring incoming radiation?  

C. You compute a climate sensitivity (without feedback) of about 1 C, about the same as that presented by CO2 alarmists. Is that a complication for a skeptic? Would it help us if climate sensitivity could be estimated to be less than 0.1 C?

Hope you can sort out A-C for me. 

My attempt to understand blackbody radiation is here https://computationalblackbody.wordpress.com

Will:

If I have understood you correctly, I don't agree with what you say about temperature and intensity or flux measurements. But I don't have time for extensive correspondence on this topic. Spectral intensity measurements are often expressed as equivalent temperatures. But the basic measurement is of energy fluxes which produce voltages or currents in sensor elements. I attach a paper that describes one such instrument. If you are not already familiar with how high-resolution spectrometers work, it would be worth your time to study the paper. A black-body calibrating source is needed to convert intensity (voltage) measurements to equivalent temperature.

Temperature is both obvious from our sensations of hot and cold, and at the same time profoundly subtle from a thermodynamic point of view. Here it is intimately associated with the idea of systems in thermal equilibrium, and with the abstract concept of entropy. The most fundamental definition of the temperature of a body in thermal equilibrium is the rate of change of its internal energy with entropy, under conditions that no work is done. This definition is usually too abstract to be of much use.

Ideal Planck radiation has a temperature and has the maximum possible entropy for radiation of a fixed total energy. But it is unusual to find real Planck radiation in nature. Besides having the Planck distribution of intensity over frequency, the radiation must also be completely isotropic. Sunlight can be roughly isotropic inside an optically thick terrestrial cloud, but the spectral intensity is orders of magnitude too weak for the sunlight to be in thermal equilibrium. Except in the interior of optically thick clouds, Earth's thermal radiation is highly anisotropic, and it usually does not have a Planck spectral distribution because of the complicated absorption spectra of greenhouse gases. But cloud particulates are pretty good grey bodies with no sharp spectral features. The particulates absorb, emit and scatter much more powerfully that greenhouse gases. So multiple scattering, emission and absorption of thermal radiation inside optically thick, isothermal clouds can produce radiation which is close to the Planck limit for the temperature of the particulates in the cloud.

Claes:

Thanks for response! I think you can settle the following issues quickly understanding that your time is limited.

1. It seems we agree that what a pyrgeometer de facto by its design measures, is temperature. Is this your opinion?

2. The instrument you refer to uses bolometers which according to definition are sensitive thermometers whose electrical resistance varies with temperature. Can we then agree that bolometers de facto by design measures temperature?

3. You say that "Spectral intensity measurements are often expressed as equivalent temperatures”. Yes, there is a connection between the temperature of a (black/grey) body and the radiative transfer/flux of heat (or in short radiation) from the body, but it depends on the temperature of the surrounding of the body and thus cannot be concluded from temperature alone. Can we agree on that?

4. A bit more precise: The idea that a body at temperature T radiates according to Planck’s law with radiative flux scaling with T^4 independent of the surrounding/background temperature, is a misinterpretation of Planck’s Law, which in correct form states that the radiation scales with (T^4 - T_b^4) with T_b the background temperature. Can we agree on this? 

(This is analysed in detail on http://computationalblackbody.wordpress.com including a new proof of the correct Planck law without resort to statistics). 

Will:


onsdag 4 april 2018

CO2: Warming or Cooling or Nothing?

Fred Singer has new post on the fundamental postulate of climate alarmism as a global temperature increase of 3 C upon doubled atmospheric CO2 as predicted by climate models.

Fred starts from the poor  correspondence between climate models predicting warming and observations of no warming, and asks the question if in fact more CO2 may have a cooling rather than warming effect.

Fred then brings in the customary elements of an Atmospheric Lapse Rate ALR and an "Effective" Altitude EA for emitting Outgoing Long Wave Radiation (OLR) from CO2, and notes a warming effect if EA lies in the troposphere and a cooling effect if EA lies in the stratosphere, assuming ALR stays the same.

Altogether, Fred's discussion shows a that it is not written in stone that CO2 has a warming effect:
  • Such is the power of group-think that even experts, with some exception, find the idea that CO2 might cool the climate difficult to accept.
Here the exception may include myself, even if I may not count as an expert, with message that the effect on global temperature of a bit more CO2 as an atmospheric trace gas, is not measurable. 

It thus may well be impossible to experimentally determine warming or cooling and the whole question of CO2 warming will only be of concern interior to climate models, which tell nothing about real climate.

This connects to a discussion I had with Fred in 2011 on the question:

torsdag 14 december 2017

Update of Talk at Climate Sense 2018: Voodoo Physics

I have put up an new version of my upcoming talk at Climate Sense 2018 with the title:
Of particular focus is the Fundamental Theorem of Calculus stating that if $F(x)$ is a primitive function of $f(x)$, that is $\frac{dF}{dx}=f$, then 
  • $\int_a^bf(x)\, dx = F(b) - F(a)$.
For example, if $f(x)=1$, then $F(x)=x$, and so we can formally write
  • $1  = \int_{100}^{101} f(x)\, dx = F(101)-F(100)=101 - 100$ 
expressing the positive quantity $\int_{100}^{101} f(x) dx = 1$ as the difference between the two (large) numbers 101 and 100. This is mathematics and not yet physics.

The radiative flux of heat energy $Q$ from a warm body of temperature $T_2$ to a colder body of temperature $T_1 < T_2$ is (essentially) given by the integral
  • $Q = \int_{T_1}^{T_2}f(\nu )\,d\nu$  
where $f(\nu )$ is the Planck spectrum with $\nu$ frequency. Here the limits of the integral scale with temperature reflecting the cut-off in frequency expressed by Wien's displacement law giving the
warm body the "overkill" spectrum $f(\nu )$ above the cut-off $T_1$ for the cold body, with the overkill effectively causing the heating while the shared spectrum below cut-off has no heating effect, as explained in more detail here.

With $F(T)=\sigma T^4$ and $F$ acting as a primitive function of the Planck function $f$, the radiative flux $Q$ can now according to the Fundamental Theorem formally be expressed in the form of the Stefan-Boltzmann Law
  • $Q =  \sigma T_2^4 - \sigma T_1^4$      
thus formally expressing the positive quantity $Q$ as the difference between two (large) numbers $\sigma T_2^4$ and $\sigma T_1^4$. 

The Voodoo Physics of the Greenhouse Effect is the result of giving the mathematical identity
  • $\int_{T_1}^{T_2}f(\nu )\,d\nu =  \sigma T_2^4 - \sigma T_1^4$
a physical meaning with the physical one-way flux $Q=\int_{T_1}^{T_2}f(\nu )\,d\nu$ expressed as the difference between the entities $F(T_2)=\sigma T_2^4$ and $F(T_1)=\sigma T_1^4$, now freely invented to be forms of two-way "radiative fluxes" back-and-forth between the bodies. From one-way physical flux are thus created two-way fluxes from a mathematical identity without any proper physical correspondence. Note in particular that $F$ as primitive function of $f$ is undetermined up to a constant, thus allowing fictitious back-and-forth fluxes of any magnitude.

Note that $F(T)=\sigma T^4$ can be interpreted physically as the one-way radiative flux from a body of temperature $T$ into a background at 0 K.  But the physics is missing of viewing the one-way radiative flux between two bodies as a difference between two separate fluxes into a background at 0 K.   

A property (identity) of a mathematical model is thus freely interpreted to be real physics, in the same way as an operation of a voodoo doll is believed to be able to have a real effect on a real person. 

This is nothing but Voodoo Physics, and this is the nature of the Greenhouse Effect based on Back Radiation from cold to warm underlying the CO2-alarmism so forcefully preached by IPCC with now Macron as ardent follower.

Macron, despite (or maybe thanks to) his education in French elite schools with all its mathematics, thus appears to be overwhelmed by the Fundamental Theorem of Calculus and cannot separate model from reality.  

                       Voodoo = operation on model believed to have real effect on real person.

PS The Pyrgeometer is a perfect example of a voodoo doll, reporting (non-physical) back radiation $\sigma T_1^4$ from a cold atmosphere at $T_1$ to warmer Earth surface at $T_2$, by measuring $Q$ and (erroneously) viewing $\sigma T_2^4$ to be radiation from the Earth surface, as
if the Earth surface was radiating directly to surrounding space at 0 K and not to the atmosphere at $T_1$ K.

You can buy a pyrgeometer from Kipp and Zonen and play with it as a voodoo doll believing it reports real physics if you want to sell CO2-alarmism. From the above analysis you may understand that in fact it represents a symbiosis of science and commercial industry serving CO2-alarmism by supplying fictional physics.


onsdag 12 juni 2013

The Dog and the Tail: Global Temperature vs CO2, continuation.

This is a continuation of the previous post.

Consider the following special case with T(t) = T_0 for t < 1970, T(t) increasing linearly for 1970 < t < 1998 to the value T_1 with T(t) = T_1 for t > 1998. The corresponding solution C(t) of the equation dC/dt increases linearly for t < 1970, quadratically for 1970 < t < 1998  and again linearly for t > 1998 as sketched by the solid lines in the following graph:

We see that after 1998 the temperature stays constant while the CO2 increases linearly. The solid lines could picture reality.

On the other hand, if you want to create a fiction of CO2 alarmism, you would argue as follows: Look at the solid lines before 1998 representing recorded reality and simply make an extrapolation until 2020 of the simultaneous increase of both T and C during the period 1970 - 1998, to get the dotted red line as a predicted alarming global warming in 2020 resulting from a continued increase of CO2. The extrapolation would then correspond to using a connection between T and C of the form T ~ C with T determined by C, instead of the as in the above model dC/dt = T with C determined by T.

This shows the entirely different global warming scenarios obtained using the model T ~ C with T determined by C, and the model dC/dt = T with C determined by T.

tisdag 11 juni 2013

The Dog and the Tail: Global Temperature vs CO2

Prof. Murry Salby's presentation in Hamburg in April is a showcase of effective scientific communication based on mathematics. Salby gives strong evidence based on observation that the offset of concentration C(t) of atmospheric CO2 as a function of time t is determined by the offset of global temperature T(t) by an equation of the form
  • dC/dt  = T   for all t > 0, C(0) = 0,
after suitable scaling of C(t). In other words, C(t) is the integral of T(t), so that if T(t) = cos(t) then C(t) = sin(t) with a time lag of a quarter of a period.  

The fact that in the equation dC/dt = T the concentration C(t) is determined by T(t), comes out as an aspect of stability (or wellposedness): Integration is a stable or well posed mathematical operation in the sense that small variations in the integrand T(t) gives small variations in the integral C(t). 

On the other hand, differentiation is a an unstable or ill posed mathematical operation: small variations dC(t) in C(t) can give rise to large variations in dC(t)/dt as a result of division by a small dt. This means that viewing T(t) in the relation dC/dt = T to be determined by C(t) corresponds to an unstable mathematical operation. 

To make a connection from cause to effect in physics, requires stability and thus in the observed relation dC/dt = T, it is C(t) which is determined by T(t) as the cause and not the other way around. Another way of expressing this fact is to say that C(t) lags T(t) with a quarter of a period, so that variations in the cause T(t) precedes the effect as variations C(t). 

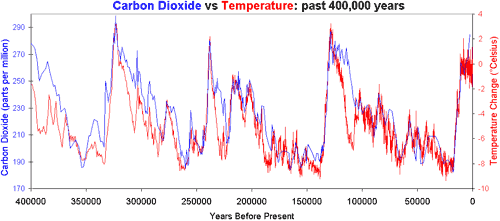
This is the observation from ice core proxies showing that temperature changes before CO2 and thus temperature is the dog and CO2 the tail with the dog wagging the tail, and not the other way around as the basic postulate of CO2 alarmism:


torsdag 16 maj 2013

Revision of Swedish Climate Politics

Swedish climate politics is based on a statement by the Royal Swedish Academy of Sciences as The Scientific Basis of Climate Change written by the Swedish meteorologist Lennart Bengtsson, a statement in close alignment with the CO2 alarmism preached by IPCC.

Lennart Bengtsson has recently in different media expressed a change of standpoint from CO2 alarmism to skepticism of CO2 alarmism. This change demands a revision of the standpoint of the Royal Swedish Academy followed by a revision of Swedish climate politics away from CO2 alarmism with far-reaching consequences concerning state support of so called green energy with little emission of CO2.

In an article transmitted by the skeptic Die Klimazwiebel  Lennart Bengtsson states:
  • ... there is an increasing tendency .... to even question basic aspects of the physics of climate change.
  • The global warming has been taken out of the hands of the meteorologists and traditional climatologists and is now run by professional media experts and different well-recognized members (political or otherwise) of the general public that have found the present climate hype to be a suitable way to remain or be obtain a place in the media limelight.
  • The real genuine interest in climate and climate processes is fading away as the interest is confined to the concept of climate typical of the general public or rather I shall say the predominant or politically correct concept of climate. 
  • Irrespective of all worrisome media report on the drama of climate change, climate is in fact warming much slower than anticipated.
  • During the period 1979-2012 for which we have reliable observations, the warming of the lower tropical troposphere, 20°S – 20°N, has only got about a third of the warming compared to what is predicted by present climate models. 
  • During the next 50 years the global primary energy must at least be increased by a factor of two that means that both fossil energy and nuclear energy will have to increase. The renewable energy is insufficient although not in theory but in practise. 
  • We do not yet know how to best solve the Earth’s energy problems but many thing may happen in the next 100 years. A modest climate sensitivity that is supported by observations combined with a transition from coal to natural gas will provide the world with a waiting time of half a century or so but not very much longer. This will make it possible to avoid unnecessary and highly expensive panic-type subsidized investments driven by political whims and the expectations of quickly earned money and instead invest available means in a well thought through long- term energy research programs.
In short, what Lennart Bengtsson is saying, is that Swedish climate politics should be changed. What Swedish politicians are now waiting for is a revision of the statement of the Royal Swedish Academy which can motivate and justify a change of politics.

PS1 My repeated question to the Royal Swedish Academy about when the revision will be presented, is answered by cold silence. But the pressure on the Academy (from Lennart Bengtsson in particular) to change the message, is increasing every day the present global cooling continues.

PS2 What would happen if the Academy listened to CNBC, instead of Swedish State Television propagating the climate statement made by the same Academy?

onsdag 3 april 2013

Sanningens Stund för KVA

SvD överger i dagens Ledare författad av Ivar Arpi sin tidigare uttalade koldioxidalarmism:
  • Det verkar som om vi har mer tid på oss än vad många alarmister har sagt. Temperaturen stiger nämligen inte som beräknat, trots att koldioxidutsläppen fortsatt att öka. 
  • Temperaturökningen har uteblivit de senaste 15 åren. Den branta stigningen har planat ut till en stabil platå trots att 100 miljarder ton växthusgaser har släppts ut under perioden, vilket är en ökning med 50 procent. 
  • Klimatet verkar vara mer motståndskraftigt än man tidigare har trott. 
  • Kina har tagit 600 miljoner människor ur absolut fattigdom med hjälp av billig kol – inte dyr solenergi. 
  • Ingen demokratiskt vald ledare är beredd att offra jobbtillfällen och tillväxt för att kanske inom hundra år ha minskat utsläppen med någon procent. Framtiden ligger inte i att höja priset på fossila bränslen... 
  • Utvecklingsländerna kommer att tacka nej till tvångströjan med minskade utsläpp... 
Det återstår nu för Kungliga Vetenskapsakademien KVA att följa SvDs exempel och revidera sitt Uttalande: Den vetenskapliga grunden för klimatförändringar, som ger stöd till den koldioxidalarmism som predikas av IPCC och som ligger till grund för svensk klimatpolitik.

Lennart Bengtsson, som är huvudförfattare till KVAs Uttalande, har redan i ett flertal framträdanden i media tagit avstånd från den koldioxidalarmism i linje med IPCC som han tidigare uttryckt.

Jag har i brev till KVA begärt besked om när revision av Uttalandet kommer att publiceras, för det måste komma, men inte fått något svar. Situationen är ohållbar för KVA och sanningens stund är nu kommen.

När KVA reviderat sitt Uttalande kommer svensk klimatpolitik att skrivas om.

PS Till dess revideringen har gjorts, står KVA för samma vetenskap som Potsdam Institute, som nu utgör laughingstock.

onsdag 20 mars 2013

The Alarmist-Skeptic-Denier Hierarchy


In the scientific discussion on global warming by a CO2 "greenhouse gas effect", we find the following main positions:
  • Alarmist: Doubled CO2 will cause warming of an alarming 3 C.
  • Skeptic: The effect of doubled CO2 is much smaller than 3 C, probably so small that it cannot be observed.
  • Denier: There is no real evidence indicating that doubled CO2 can caused any observable warming. 
The discussion is carried by strong feelings in a hierarchy with alarmists being so upset with skeptics that they refuse to discuss with skeptics, and skeptics being so upset with deniers that they refuse to speak with deniers, and deniers being upset because nobody at all is willing to listen to their message.

But the real dividing line is between alarmists and skeptics/deniers with the difference between skeptic and denier more semantic than real: 

In science, an effect which cannot be observed may be considered to be non-existing, that is the effect is denied existence until detection. It is also possible to argue that the effect in principle is there, but is too small to be detected by instruments available today, that is the effect is allowed existence before actual detection. The net result in both cases is an effect beyond present experimental detection, and it is a question of vocabulary whether or not such an effect can be attributed existence. 

Maybe this could help to make skeptics less upset with deniers and direct their frustration instead to alarmists.  

tisdag 19 mars 2013

The Fabrication of CO2 Alarmism Decoded 4


The scientific evidence behind CO2 alarmism consists of OLR spectra produced by a combination of modeling and measurement (Modtran/Hitran/IRIS) predicting a radiative forcing of 3.7 W/m2 by doubling the concentration of atmospheric CO2 from a preindustrial level of 300 ppm to 600 ppm (with 390 ppm the present level) with an estimated warming effect of 1 C. 

The OLR spectra are computed by radiative transfer models based on models of spectral emissivity of atmospheric CO2 determined by line spectra combined with line broadening models, which determine a  warming effect of 3.7 W/m2 from doubled CO2 resulting from an increase of the effective altitude of emission on the "shoulders" of the line spectrum of CO2 around the main resonance at wave number 667 forming a ditch in the spectrum between 550 and 800 with a total area representing a warming of about 20 W/m2, about one tenth of a total of about 200 W/m2 as shown in a previous post.

This effect can be studied more closely by the online Gas-Cell Simulator by Spectral Calc, which gives the following absorptivity for an atmosphere at 0.5 bar with 300 and 600 ppm of CO2 at a path length of 2000 m: 


The Gas-Cell Simulator shows an absorptivity increasing with p x L, where p is the partial pressure of CO2 and L the path length, with a switch to absorptivity greater than 0.5 (defining an effective emission altitude) occurring between 300 and 600 ppm CO2 at a path length of 2000 m (with full saturation between wave numbers 640 and 700).

The effective altitude of OLR emission for wave numbers 580 - 620 on the left shoulder may thus be estimated to increase by 2000 m upon doubling of CO2 until the tropopause is reached, which could mean a temperature drop of 13 C. With a shoulder width of 80 out of a total width of 250 the CO2 ditch between 550 and 800 and 13 C about one fifth of the total temperature drop in the ditch of about 65 C, this gives a warming effect of about 0.3 x 0.2 x 20 = 1.2 W/m2 for one shoulder.

We thus arrive at a warming effect of about 2 - 3 W/m2  from an increase of CO2 from 300 to 600 ppm, which gives an insight into the background of the crucial 3.7 W/m2 as the starting point of climate alarmism. 

We see that the effect comes from a simple model of line broadening of the weak spectral real lines on the shoulders of the CO2 spectrum around the main resonance at 667. The model is simplistic and the effect is so small that it cannot be measured, and so from scientific point of view it can only be viewed as a speculation which could as well be half or twice as big, thus without much substance. 

Yet this is the main scientific evidence put forward in support of CO2 alarmism. Note that the fact that the number 3.7 W/m2 cannot be trusted as scientific evidence, does not itself give reason to restrictions on CO2 emissions putting more burdens on humanity. Lack of evidence is not a reason to put someone in jail. What would be needed is positive scientific evidence that CO2 can cause global warming with observable negative effects, but that is missing.

PS  When climate skeptics state that for sure they understand very well that there is a CO2 greenhouse effect, as any knowledgable scientist must do,  they refer to the radiative forcing of 3.7 W/m2 with 1 C warming from doubled concentration, but then forget that this effect has very weak scientific support. They seem to get caught in an argument stating that even if the effect is too small to ever be detected, the effect is undeniably real as an expression of the line spectrum of CO2.

But this means violating the essential principle of science to not give a negligible effect a major role, which is required in order to be able to make meaningful predictions as the goal of science.         

torsdag 14 mars 2013

The Fabrication of CO2 Alarmism Decoded 2

Let us continue the evaluation of the basic evidence of CO2 warming in the form of OLR spectra generated by (i) the software Modtran and (ii) the IRIS spectrometer carried by the Nimbus 4 satellite:

We see that the OLR spectrum generated by (i) Modtran based on the Hitran line spectrum database (red) and (ii) from direct measurements by the IRIS spectrometer data (black), are essentially the same. This does not mean that theory and measurement give the same result, which is bingo in science, but only that both OLR spectra are computed using the same model for radiative (heat) transfer based on line spectra data from Hitran and IRIS, which happen to be similar. The close similarity thus gives a warning sign rather than confirmation of correctness.

The warming effect of CO2 is expressed by the ditch in the spectrum between wave numbers 550 and 800, with the bottom of the ditch associated with the emission temperature 220 K occurring in the tropopause. This is the minimum temperature of the atmosphere and thus gives maximal warming effect of CO2. Running Modtran with different concentration of CO2 from 50 ppm to 1000 ppm puts the bottom of the ditch at 220 K with the central resonance at 667 climbing to higher temperature reflecting emission from the stratosphere.

Modtran/IRIS translates a line spectrum to a continuous spectrum with the CO2 warming effect expressed as the area of the ditch in the spectrum between 550 - 800. The area depends on the bottom of the ditch anchored at 220 K for CO2 concentrations larger than 50 ppm, and on the width which is slightly increasing with increasing concentrations. The warming effect of doubled CO2 from 300 ppm then comes out to be 3.7 W/m2, which serves as the starting point of CO2 alarmism. This effect is not directly measured but comes from a model of line broadening in a translation of a line spectrum to a continuous spectrum.

In an upcoming post I will scrutinize the line broadening model. To prepare, note that the emission altitude and thus temperature is determined by the fact that the atmosphere above that altitude is essentially transparent to the chosen wave number. Increasing CO2 concentration will then mean increasing altitude and then cooling above the tropopause as seen for 667. The key question of OLR can thus be reduced the tractable problem of transparency at sufficient altitude without resolving the complex heat transfer within the atmosphere. This makes it possible to decode fabrication of artificial warming if present.

onsdag 13 mars 2013

The Fabrication of CO2 Alarmism Decoded 1

The scientific evidence in support of CO2 global warming alarmism consists of the following outgoing long wave radiation OLR spectrum produced by a combination of mathematical modeling and measurement in the form of the software Modtran and the Nimbus 4 Iris interferometer:

The graph shows the difference in OLR between preindustrial level of 300 ppm (green curve) and doubled 600 ppm (blue curve on top of green), which is seen as a slight widening of the ditch between wave numbers 550 and 800 attributed to CO2 and which amounts to a warming effect of 3.7 (or 3.39) W/m2. This is the prime  scientific evidence of a global warming effect of doubled CO2 of 3.7 W/m2, which commonly is translated to a warming of 1 C, an evidence which has been cut in stone as an undeniable truth basooned by CO2 alarmists and not questioned by leading climate sceptics.

The OLR spectrum shows the continuous spectrum radiated from the Earth surface through the "atmospheric window" for wave numbers 800 - 1200, and the jagged line spectrum of H2O for wave numbers up to 550, and the ditch 550 - 800 attributed to CO2, which is the evidence of CO2 warming.

The spectrum in the ditch with it's flat bottom at 220 K, is constructed in a two-step procedure:
  1. Identification of a line spectrum from the presence of CO2 (Hitran, interferometer).
  2. Translation of the line spectrum to a continuous spectrum defining atmospheric irradiance (Modtran modeling).  
Step 1 can be performed as direct physical measurement (as shown in Radiation of Solid vs Gas), while Step 2 is based on a model of spectral line broadening which determines the irradiance supposedly resulting from the line spectrum. 

The scientific basis of CO2 alarmism thus rests on a mathematical model of broadening of the line spectrum of the trace gas CO2 and the mathematical model is very simple as it describes the line broadening in terms of the parameter p x L where p is the partial pressure of CO2 and L is the path length. 

Classical experiments by Hottel and Leckner  concern the case p ~ 1 bar and L ~ 1 m, while for atmospheric CO2 warming p ~ 0.0001 bar and L ~ 10000 m, to which direct extrapolation may not be possible. 

The net result is that CO2 alarmism is based on a simple mathematical model without direct experimental support and thus is ready to collapse once this fact becomes known and acknowledged, first by climate skeptics then by the general public and finally by CO2 alarmists.   

The next post will in more detail analyze the fabrication of the CO2 ditch in the OLR spectrum as the main evidence of CO2 warming put forward.

lördag 9 mars 2013

Tyndall's Experiment as Basis of CO2 Alarmism

CO2 alarmism goes back to experiments by John Tyndall reported in the Philosophical Transactions of the Royal Society as THE BAKERIAN LECTURE: On the Absorption and Radiation of Heat by Gases and Vapours,and on the Physical Connexion of Radiation, Absorption, and Conduction, February 7, 1861.

Tyndall describes the apparatus used to study the radiative power of different gases as follows:


In short, the emissivity of different heated gases were recorded by a thermopile with the following result:
  • air, oxygen, nitrogen, hydrogen: 0
  • carbonic oxide: 12
  • carbonic acid: 18
  • nitrous oxide: 29 
  • olefiant gas: 53.  
The experiments thus showed a definite measurable emissivity of high concentration of CO2, but no measurable emissivity for air with low concentration of CO2 (for a closer analysis see Text of Tyndall). 

Yet the experiments by Tyndall are often presented as the first key evidence of the warming effect of atmospheric CO2 followed by On the Influence of Carbonic Acid in the Air upon the Temperature on the Ground (1896) by Swedish Nobel Laureate Svante Arrhenius (fearing a coming ice age by too little CO2).  

Summary of Non-Evidence of CO2 Global Warming

Here is a summary of recent posts on the lack of scientific evidence in support of CO2 alarmism:


The evidence of global warming from increasing concentration of atmospheric CO2 as a "greenhouse gas" in support of CO2 alarmism propagated to the world and its political leaders by IPCC and governmental institutions, consists of
  1. Direct observation of global temperature and CO2 concentration. 
  2. But the last 15 years with no global warming under rising CO2 gives no reason for CO2 alarmism. 
  3. Modtran/Hitran as a combination of model theory and laboratory measurement serves as the main evidence of "radiative forcing" of 3.7 W/m2 from doubled CO2 to 600 ppm commonly translated to a global warming of 1 C.
  4. But Modtran gives a "radiative forcing" from the present 390 ppm to 600 ppm of only 2 W/m2 translated to a warming of 0.5 C, which is so small that it cannot be observed.
  5. The Modtran model results are either unreliable with no predictive value (most likely), or reliable with no reason for alarm.     
The net result is that there is no scientific evidence in support of CO2 alarmism. Hence, there is no rational reason to impose restrictions on emissions of CO2.

fredag 8 mars 2013

CO2 vs H2O as GreenHouse Gas: No Alarm

Modtran online gives the following output for a 1976 US std atmosphere, CO2 = 375 ppm, water vapor scale = 1, CH4 = 1.7 ppm, trop Ozone = 28 ppm, strat Ozone scale = 1:


We see in the lower plot that water vapor H2O is concentrated to the lower troposphere, while CO2 is spread out through the whole atmosphere.

The OLR spectrum in red shows the effect of water vapor as emission in the lower troposphere at a temperature of about 250 K for wave numbers smaller than 550, and the effect of CO2 as emission in the upper troposphere at a temperature of about 220 K for wave numbers in the range 550 - 800.

What determines the effective emission temperature/altitude and thus the OLR spectrum, is the transparency of the atmosphere above the effective emission altitude.  If CO2 was concentrated to the lower troposphere the effective emission temperature in the band 550 - 800 would be higher with an increase of OLR and thus a smaller warming effect from CO2.

The key question of the effect of increasing CO2 to 600 ppm from the present 390 ppm, is thus the effect on the transparency of the atmosphere in the band 550 - 800 in the upper troposphere and tropopause. Modtran shows this effect to be


We see a warming of 2 W/m2 as an effect of a slightly wider/deeper ditch for wave numbers 550 - 800 including the main resonance of CO2 at 667.

We observe that the 2 W/m2 is about half of the basic postulate of CO2 alarmism of 3.7 W/m2 upon doubling from 300 ppm, and that these 2 W/m2 come out from a very subtle change of transparency with small broadening of the ditch in the CO2 spectrum for emission at 240 - 250 K, on the "shoulders" of the CO2 spectrum around 667. Experimental support of this effect is missing, and the effect may just be an artifact of an ad hoc assumption in Modtran with emissivity simply scaling with path length.

Summary:
  • The effect of H2O as greenhouse gas GHG is seen in the OLR spectrum as a substantial decrease of effective emission temperature in the lower troposphere for wave numbers smaller than 550. 
  • The 2 W/m2 of "radiative forcing" from doubled CO2 is the result of a subtle effect of line broadening on the shoulders around 667 at low pressure and long path length. The warming effect of 2 W/m2 is commonly translated to a global warming of 0.5 C, which is to small to be observed. 
  • Modtran shows a substantial effect of water vapor and a negligible effect of CO2.
  • Modtran is presented as the main evidence of a possibly alarming global warming from doubled CO2, but if anything Modtran shows that the effect is too small to be observed and thus cannot be alarming. 

torsdag 7 mars 2013

Hard Evidence of CO2 Warming Missing

The key to the "radiative forcing" of 3.7 W/m2 of doubled atmospheric CO2 as the only hard scientific evidence of CO2 alarmism,  is made visible in the following spectra (covering wave numbers 600 - 700) computed by Spectral Calc showing the transmittance through a column of air at 0.2 bar with 0.039% CO2 of length L = 10000 m (top), 1000 m (middle) and 100 m (bottom):


We see that the sparse line spectrum of CO2 for 100 m with high transmittance (bottom) is turned into a band spectrum for 10000 m with low transmittance (top) as an effect of line broadening by increasing path length. This is the line broadening behind the radiative forcing of 3.7 W/m2 as the only hard evidence of CO2 warming.

We can thus focus the scientific analysis of the basis of CO2 alarmism to the question of line broadening of CO2 as a trace gas with concentration of about 0.04%, as shown by Spectral Calc (or Modtran):
  • main 667 line is fully absorbing (transmittance = 0) with width 2 for L = 10 m
  • weak lines in the band 600 - 700 have almost full transmittance for L = 100 m
  • weak lines in the band 600 - 700 have reduced transmittance for L = 1000 m
  • weak lines in the band 600 - 700 have no transmittance for L = 10000 m. 
We are thus speaking about an effect of a trace gas in a model of radiative transfer which is notable only over path lengths larger than 1000 m. This is an effect that cannot be measured directly and can only be computed by making an assumption in a model which likewise cannot be experimentally verified.

CO2 thus rests on an assumption of "radiative forcing" of 3.7 W/m2 from doubled CO2 which has not (and cannot) been experimentally verified. It may well be completely wrong as any ad hoc assumption about a subtle phenomenon.

Nevertheless this "radiative forcing" of 3.7 W/m2 has come to serve as the key hard science fact underlying CO2 alarmism. 

Surprisingly it has come to be fervently defended as an "undeniable fact" also by skeptics of CO2 alarmism, thus undermining the skepticism. Why this is so remains to be explained by future historians of CO2 alarmism. It may be that the argument that the transmittance spectra are based on quantum mechanics has so impressed skeptics that the skepticism has evaporated.

PS The model assumption is that transmittance depends on p x L, where p is total pressure (bar) and L is path length (m), with almost full transmittance if p x L < 20 and little transmittance if p x L > 200. The formula can be tested experimentally in laboratory for L ~ 10 but in applications to the atmosphere L = 1000 - 10000 and the question is if the simple proportionality to L is valid for such large values.   

onsdag 6 mars 2013

How Thick is the Atmosphere?


The theoretical model of blackbody radiation as radiation through a peephole of an empty cavity (with soothed walls) is independent of the mass of the cavity (which is zero). This model property reflects a passive quality of (blackbody) radiation as emission of what is absorbed, no more no less.

A solid body like a glowing lump of iron has a full continuous blackbody spectrum covering all frequencies, while a gas has more or less thin line spectrum as discussed in a previous post on radiation of solid vs gas.

The wave model of blackbody radiation analyzed on Computational Blackbody Radiation represents a solid body consisting of a lattice of atoms capable of coordinated vibration emitting infrared radiation with a continuous spectrum of wave lengths several orders of magnitude larger than atomic dimensions. The model can be seen as a set of oscillators with small damping in equilibrium with external forcing with resonance frequencies covering all frequencies (up to a cut-off scaling with temperature).

Restricting this model to a set of oscillators with only selected resonances gives a model of a gas which does not appear to have the capacity of coordinated vibration on scales larger than atomic scales. The line width of the model is about 1 Hz.

The warming effect of 0.039% atmospheric CO2, as observed in the previous post, results from the continuous ditch in the Modtran OLR spectrum in the whole interval 550 - 800 around the main resonance at wave number 667, and is (very surprisingly so) comparable to the warming effect of 2% water vapor as the main "greenhouse gas".

The continuity of the Modtran OLR spectrum in the ditch comes from considerable broadening of the line spectrum of CO2 as an effect of a 10000 m thick troposphere. With a path length of only 1000 m the spectrum would be sparser and the CO2 warming effect maybe 10 times smaller.

So here is the question: Does a 10000 m thick atmosphere radiate like a solid with a continuous spectrum, while a 1000 m thick atmosphere radiates like a gas with a line spectrum?

Hint: If continuity of the OLR spectrum requires coordination over lengths much larger than molecular, does a 10000 m thick atmosphere offer more coordination than a 1000 m thick?

PS1 Hottel charts tabulate air emissivity using the product p x L as parameter, where p is the partial pressure of CO2 and L the path length, where thus a small partial pressure/concentration can be compensated by a large path length. In experiments the path length can be of size a few meters and the question is if the p x L dependence can be extrapolated to thousands of meters?

PS2 It is not easy as outsider to judge the validity of software like Modtran/Hitran since both models and programing is complex. But if software results contradict reason, then something may be seriously wrong and if something is seriously wrong then it may be possible to identify what it is.

PS3 Compare with How Deep is the Ocean?   

Hard Evidence of CO2 Warming Inflated by Factor 20

The hard scientific evidence of the warming effect of atmospheric CO2 consists of radiation spectra computed by the atmospheric radiation model Modtran, predicting a "radiative forcing" of 3.7 W/m2 from doubling of the concentration of CO2 to 0.06% from preindustrial level of 0.03% (by volume)

To get perspective, let us use the online model of Modtran to compare the present 0.039% of CO2 with a typical value of 2% water vapor (by volume). We get the following OLR spectrum for a 1976 USA standard atmosphere with 1.7 ppm CH4, trop. ozone 28 ppb, strat ozone scale 1:


We see the effect of water vapor as the area between the blue to the red curve for wave numbers smaller than 550 and the effect of CO2 as the comparable area between 550 and 800, thus with an effect of 0.039% of CO2 comparable to that of 2% water vapor. More precisely, Modtran gives the following OLR numbers:
  • CO2 = 390, water vapor 2%: 248 W/m2
  • CO2 = 0, water vapor 0%: 337 W/m2
  • CO2 = 390, water vapor 0%: 304 W/m2
  • CO2 = 0, water vapor 2%: 273 W/m2
which shows an effect of 0.039% CO2 which is about half of that of 2% water vapor.

Modtran thus attributes a warming effect of the CO2 molecule which is at least 20 times more powerful than that of water vapor!!

We can now summarize the recent posts on Modtran as follows:
  • Modtran is the main hard evidence of the warming effect of CO2.
  • Modtran appears to inflate the warming effect of CO2 by factor more than 20.
PS1 In the above example the water vapor concentration was in fact 5% (water vapor scale = 2 in Modtran). Considering the more standard case of water vapor scale = 1 with thus 2.5% water vapor, we get the following numbers
  • CO2 = 390, water vapor 2.5%: 259 W/m2
  • CO2 = 0, water vapor 0%: 337 W/m2
  • CO2 = 390, water vapor 0%: 304 W/m2
  • CO2 = 0, water vapor 2%: 286 W/m2
which shows an effect of 0.039% CO2 which is again about half of that of 2.5% water vapor, with the same inflation factor of 20.

PS2 The comparison of 0.04% of CO2 vs 2% water vapor does not take into account the fact that the concentration of water vapor falls off with altitude while that of CO2 does not. If included this reduces water vapor to 0.5% that is about 10 times as much as CO2. The factor 20 then gets replaced by 5, which is still remarkable. Compare with a later post.

måndag 4 mars 2013

Modtran: One Fly Lifting 20 Kilo


CO2 global warming alarmism is based on a prediction of "radiative forcing" of 3.7 W/m2 upon doubling of CO2 concentration from preindustrial level of 300 ppm to 600 ppm, obtained by the radiative transfer model Modtran available online.

Here is the "back radiation" or downwelling long wave radiation DLR from the atmosphere to the Earth surface predicted by Modtran looking up from the ground through a standard atmosphere with water vapor scale = 0 combined with 1 ppm CO2 (top) compared with 0 ppm CO2 (bottom):

We see a "radiative forcing" effect on the ground of 11 W/m2 by increasing the CO2 concentration from 0 ppm to 1 ppm represented by the peak in the radiation spectrum around the main resonance at wave number 667 in the top graph.

With water vapor scale = 1 (%), we see a corresponding increase of the "back radiation" or DLR from 226.5 to 231.7 W/m2, with in this case a "radiative forcing" of 5 W/m2 from just 1 ppm of CO2.

Modtran thus assigns 1 ppm of CO2 an effect of "radiative forcing" of 5 - 10 W/m2, as a result of considerable broadening of the line spectrum at 667, visible as the peak in the upper graph.

This is another view of the drop in outgoing longwave radiation OLR noted in a previous post of 6 W/m2 by changing CO2 from 0 to 1 ppm.

Modtran assigns 0.0001% of CO2 a warming effect of 5 - 10 W/m2? Is this reasonable? Can we believe in what seems so utterly unreasonable?

Is it really possible that 0.0001% of CO2 can give a fully transparent atmosphere of O2/N2 molecules an absorptivity/emissivity > 2%, with thus an amplification factor of 20.000 from 0.0001% to 2%?? Is it possible that a 1 g fly can lift 20 kg? Try Modtran yourself to find an answer.

If it is not possible, then CO2 alarmism rests on an impossibility.

PS1 Here is the input to Modtran from Hitran for the main resonance at wave number 667:


Notice the sparsity of the radiation spectrum (per CO2 molecule) away from an interval around wave number 667 of width 2 - 3, from which Modtran evidently is able to make a big deal.

We have now traced the proclaimed scientific evidence of CO2 global warming to the interplay between Hitran and Modtran, which may help to focus the discussion. Remember that the "radiative forcing" of 3.7 W/m2 from doubling of CO2 produced by Modtran, is the key scientific evidence of  CO2 global warming alarmism. Maybe the time has now come to seriously judge its validity.

PS2 Here is a Spectral Calc computation of transmittance of 1 ppm of CO2 over 1000 m (top) and 10000 m (bottom) at 0.5 bar total pressure:


We see absolute transparency for 1000 m except in the interval around 667 - 669 and a slight reduction of the transmittance by increasing the thickness from 1000 m to 10000 m. We see that Spectral Calc attributes an increase of atmospheric absorptivity of about 1% from the shoulders of 667 - 669 from  10000 m of 1 ppm of CO2 at 0.5 bar total pressure. This is 3 times smaller than the result by Modtran predicting a warming effect of 5 - 10 W/m2 for 10000 m of 1 ppm  CO2, which is not present for only 1000 m. A very subtle phenomenon indeed.

We understand that Modtran aims at capturing a needle in a haystack and as a model with limited accuracy has to choose between taking the whole haystack along with the needle or missing the needle completely.

PS3 Swedish archaeologist Johan Norberg remarks that
  • the Swedish idiomatic expression “att göra en höna av en fjäder” translates as “to create/make a hen out of a feather". It basically means to make up facts about something we know very little of, to blow things out of proportions.
CO2 alarmism is an example out blowing things out of proportion with a thousandfold blow-up.  

PS4 The above Hitran spectrum is the input to Modtran, which adds (pressure) line-broadening to produce the Modtran spectrum. It is natural to ask if all the spectral lines on the shoulders away from 667 will be fully activated in broadened form by IR radiation from the Earth surface. The spectral lines represent possible resonances rather than actual resonances and the net effect after passage through the entire thickness of the atmosphere, may well be impossible to assess by computation. Since experimental verification of such a subtle phenomenon also seems impossible, what remains is Modtran model prediction which cannot be assessed experimentally and thus cannot be counted as science.  Yet this serves as the basis of CO2 alarmism with the 3.7 W/m2 of "radiative forcing" from doubling as the key number. But the number 0.37 W/m2 is much more plausible and with this number there can be no CO2 alarmism.

PS5 Note the recent guest post on WUWT on Categorical Thinking as thinking without quantity, which says that since CO2 is a greenhouse gas, even if drowned by H2O, then CO2 will have a warming effect, even if this effect is so small that it can never be measured, and thus humanity must reduce its emissions to the atmosphere by drastic means, even if the the effect of the reduction can never be observed.  This is not scientific mathematical thinking which is all about quantity.  

fredag 1 mars 2013

Evidence of CO2 Warming Supplied in School Projects


CO2 global warming alarmism is based on a postulate of "radiative forcing" of 3.7 W/m2 from doubling of the concentration of atmospheric CO2 from preindustrial level of 300 ppm, with an associated warming effect of about 1 C, which after postulated positive feedback becomes an alarming 3 C. Without the radiative forcing of 3.7 W/m2, CO2 alarmism collapses to zero.

The radiative forcing of 3.7 W/m2 upon doubling of atmospheric CO2 is based on radiative transfer models based on models for absorption/emission spectra, but direct atmospheric experimental verification is lacking.

Even more conspicuously, laboratory measurements of absorptivity/emissivity of air with the low concentrations of CO2 present in the atmosphere which could support the 3.7 W/m2, are very sparse as evidenced here. The early work by Tyndall (1860s) and Arrhenius (1896) still remain as main references.

What is readily available on the web are many examples of school projects where young people are guided to supply the experimental evidence of CO2 warming which is lacking.

PS1 The main reference beyond Tyndall and Arrhenius is Hottel/Leckner with the following typical chart showing the emissivity of CO2  depending on temperature and partial pressure p_CO2 x L (atm-m), where p_CO2 = 0.00039 the partial pressure of CO2 at a total pressure of 1 atm and L is the optical thickness of CO2 which is about 1 m around the main resonance at wave number 667.
We read from the chart a total CO2 emissivity smaller than  0.01, which means a total "radiative forcing" of less than 2 W/m2 from the present 390 ppm of CO2. This makes the 3.7 W/m2 from doubling from 300 to 600 pm utterly improbable because of almost complete saturation already at 390 with only a small effect from pressure broadening possibly remaining up to 600.

Th 3.7 W/m2 of "radiative forcing" from doubled CO2 may well be the biggest scientific "hockey stick" ever fabricated, so cleverly concocted that even prominent climate skeptics have been convinced.

PS2 Here are two Spectral Calc computation showing that the optical thickness of air with 390 ppm CO2 at a total pressure of 1 bar, is about 1 m at main resonance 667 (top graph: length = 1 m, bottom graph: length = 10 m), with a line broadening of about 2 cm^-1 in accordance with the near-resonance of Mathematical Physics of Blackbody Radiation.